こんにちは、タイミーのデータ統括部データサイエンス(以下DS)グループ所属の菊地です。
今回は、タイミーがBIツールとして導入しているLookerでの、H3を使用した可視化をするための取り組みを紹介したいと思います!
H3とは
H3とは、Uber社が開発しているグリッドシステムで、オープンソースとして提供されています。
H3では、位置情報に紐づいたイベントを階層的な六角形の領域にバケット化することができ、バケット化された単位でデータの集計が可能になります。
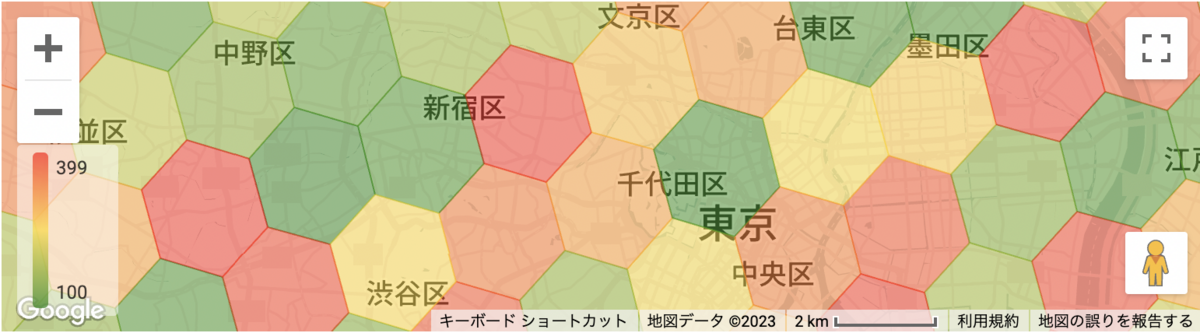
タイミーでは、サービスを提供する各都市の需給を測定するために,六角形単位で集計したデータを可視化するなど、様々な場面での分析に活用しており、例えば以下のような可視化を行なっております(数値はランダム値です)。
H3についての詳細は、以下のページが参考になるかと思います。
前提条件
LookerのデータソースはGoogle Cloud BigQueryとします。
可視化に必要な各種ファイルの生成にはPythonを用いており、使用しているPythonバージョンと、依存ライブラリのバージョンについては、以下で動作確認を行っています。
- Pythonバージョン: 3.11.4
- 依存ライブラリ
geojson==3.0.1
h3==3.7.6
numpy==1.25.2
pandas==2.0.3
shapely==2.0.1
topojson==1.5
また、大変簡略化した例ですが、データソースのBigQueryプロジェクト・データセット・テーブルは、以下の想定とします。
- プロジェクト名:
sample-project - データセット名:
sample-dataset - テーブル
sales: 売上データを保持しているテーブルsales_at: 売上の日時amount: 売上place_id:placesテーブルの外部キー
places: 位置情報(緯度・経度)を保持しているテーブルplacesテーブルとsalesテーブルには1:nのリレーションが存在
erDiagram

places ||--|{ sales: "1:n"

places {
  INTEGER id
  FLOAT latitude
  FLOAT longitude
}

sales {
  INTEGER id
  DATETIME sales_at
  INTEGER amount
    INTEGER place_id
}
Lookerでの可視化を行うための手順
今回は以下の手順に従って、上記saleテーブルの売上をH3六角形にバケット化し、Looker上で可視化します。
- 緯度経度情報を保持しているBigQueryテーブルにH3六角形IDを付与し、別テーブルとして保存
- TopoJsonファイルの作成
- 作成したTopoJsonファイルをLookerに追加
- Lookerのmodelファイルにmap_viewフィールドを追加
- Lookerのviewファイルにdimensionを追加
- Lookerのmodelファイルにexploreを追加
- Lookerでの可視化
1. 緯度経度情報を保持しているBigQueryテーブルにH3六角形IDを付与し、別テーブルとして保存
集計の際に使用する「緯度経度情報を保持しているBigQueryテーブル」(ここではplacesテーブル)に対して、H3六角形ID(以下H3 hex idと記載)を付与し、別テーブルとして保存しておきます。ここではh3_placesテーブルとして保存しています。
下記は、placesテーブルをpandas.DataFrameとして読み込み、H3六角形解像度0~15までのH3 hex idを付与し、テーブルとして書き出すコードの例です。
H3六角形解像度は値が大きくなるにつれて、小さな六角形(=解像度が上げる)になり、詳細については下記ドキュメントが参考になるかと思います。
import h3
import pandas as pd


class BigQueryClient:

    def __init__(self):
        ...

    def read_table_as_dataframe(self, table_id: str) -> pd.DataFrame:
        """BigQueryテーブルをpandas.DataFrameとして読み込む処理"""
        ...

    def write_table_from_dataframe(self, df: pd.DataFrame, table_id: str) -> None:
        """pandas.DataFrameをBigQueryテーブルを書き込む処理"""
        ...


def make_h3_hex_ids(df: pd.DataFrame) -> pd.DataFrame:
    _df = df.copy()
    for resolution in range(16):
        # 緯度・経度情報を元に、H3 hex idを付与
        _df[f'h3_hex_id_res_{resolution}'] = df.apply(lambda x: h3.geo_to_h3(x['latitude'], x['longitude'], resolution),
                                                      axis=1)
    return _df


if __name__ == '__main__':
    ...
    bq_client = BigQueryClient()

    # 緯度(latitude)、経度(longitude)を保持しているBigQueryテーブルをDataFrameとして読み込む
    df = bq_client.read_table_as_dataframe('sample-project.sample-dataset.places')

    # H3 hex idを付与する
    h3_df = make_h3_hex_ids(df)
    h3_df.rename(columns=dict(id='place_id'), inplace=True)

    # H3 hex idを付与したDataframeをBigQueryテーブルとして書き込み
    bq_client.write_table_from_dataframe(df=h3_df, 'sample-project.sample-dataset.h3_places')
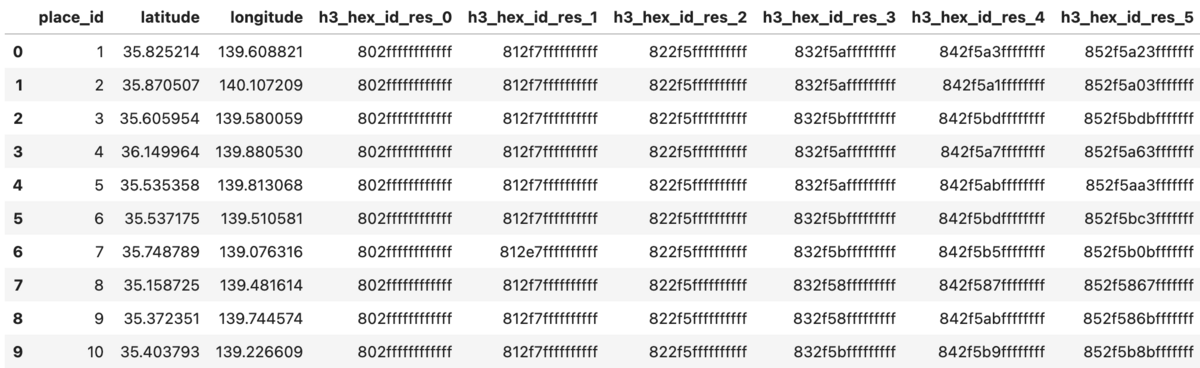
例として、以下のような緯度経度を保持しているサンプルデータに、H3 hex idを付与した場合、以下のような結果になります。
import numpy as np


np.random.seed(42)

tokyo_latitude = 35.6762
tokyo_longitude = 139.6503

df = pd.DataFrame(
    [[i, np.random.normal(tokyo_latitude, 0.3), np.random.normal(tokyo_longitude, 0.3)] for i in range(1, 11)],
    columns=['place_id', 'latitude', 'longitude']
)

h3_df = make_h3_hex_ids(df)
h3_df.head(10)
2. TopoJsonファイルの作成
「1. 緯度経度情報を保持しているBigQueryテーブルにH3 hex idを付与する」でH3 hex idを付与したDataFrameを元に、TopoJsonファイルを作成します。
TopoJsonの詳細についてはこちらの「topojson」GitHubリポジトリを参照してください。
下記は、TopoJsonファイルを作成するコード例です。
処理の内容としては、GeoJson形式を経由して、TopoJsonに変換し、ファイルとして出力をしています。
TopoJsonファイルは、H3解像度別に作成しています。
from pathlib import Path

import geojson
import h3
import pandas as pd
from shapely import geometry
import topojson


class H3ToGeojson:

    @staticmethod
    def get_h3_geojson_features(h3_hex_ids: list[str]) -> list[geojson.Feature]:
        polygons = h3.h3_set_to_multi_polygon(h3_hex_ids, geo_json=True)
        features = [geojson.Feature(geometry=geometry.Polygon(polygon[0]), properties=dict(h3_hex_id=h3_hex_id)) for
                    polygon, h3_hex_id in zip(polygons, h3_hex_ids)]
        return features

    def get_h3_geojson_feature_collection_from_dataframe(self, df: pd.DataFrame,
                                                         h3_hex_id_column: str) -> geojson.FeatureCollection:
        assert df.columns.isin([h3_hex_id_column]).any(), f'column `{h3_hex_id_column}` is not exists.'

        unique_h3_hex_ids = df[h3_hex_id_column].unique().tolist()
        geojson_features = self.get_h3_geojson_features(unique_h3_hex_ids)
        feature_collection = geojson.FeatureCollection(geojson_features)
        return feature_collection


class H3ToTopojson:

    def __init__(self):
        self.h3_to_geojson = H3ToGeojson()

    def get_h3_topojson_topology_from_dataframe(self, df: pd.DataFrame, h3_hex_id_column: str) -> topojson.Topology:
        feature_collection = self.h3_to_geojson.get_h3_geojson_feature_collection_from_dataframe(
            df,
            h3_hex_id_column=h3_hex_id_column
        )
        return topojson.Topology(feature_collection, prequantize=False)

    def make_h3_topojson_file_from_dataframe(self, df: pd.DataFrame, h3_hex_id_column: str,
                                             save_file_path: Path) -> None:
        topojson_topology = self.get_h3_topojson_topology_from_dataframe(df=df, h3_hex_id_column=h3_hex_id_column)
        topojson_topology.to_json(save_file_path)


if __name__ == '__main__':
    ...

    h3_to_topojson = H3ToTopojson()
    save_dir = Path('topojson')
    save_dir.mkdir(exist_ok=True)

    for resolution in range(0, 16):
        h3_hex_id_column = f'h3_hex_id_res_{resolution}'
        h3_to_topojson.make_h3_topojson_file_from_dataframe(df=h3_df, h3_hex_id_column=h3_hex_id_column,
                                                            save_file_path=save_dir / f'{h3_hex_id_column}.json')
例として、先ほど作成したサンプルデータに対して、resolution=4を指定してTopoJsonファイルとして書き出す処理は以下のようになります。
h3_to_topojson = H3ToTopojson()
h3_to_topojson.make_h3_topojson_file_from_dataframe(h3_df, resolution=4)
TopoJsonファイルの中身は以下のようになります。
{"type":"Topology","objects":{"data":{"geometries":[{"properties":{"h3_hex_id":"842f5a3ffffffff"},"type":"Polygon","arcs":[[-5,-2,0]],"id":"feature_0"},{"properties":{"h3_hex_id":"842f5bdffffffff"},"type":"Polygon","arcs":[[1,-4,2]],"id":"feature_1"},{"properties":{"h3_hex_id":"842f5abffffffff"},"type":"Polygon","arcs":[[3,4,5]],"id":"feature_2"}],"type":"GeometryCollection"}},"bbox":[139.198358,35.267135,140.126313,36.103519],"arcs":[[[139.44526,35.765969],[139.458427,36.000295],[139.695196,36.103519],[139.918545,35.971536],[139.903854,35.7366]],[[139.44526,35.765969],[139.667342,35.634256]],[[139.653549,35.399825],[139.419179,35.297723],[139.198358,35.429167],[139.21065,35.662982],[139.44526,35.765969]],[[139.653549,35.399825],[139.667342,35.634256]],[[139.667342,35.634256],[139.903854,35.7366]],[[139.903854,35.7366],[140.126313,35.603627],[140.111006,35.368594],[139.874758,35.267135],[139.653549,35.399825]]]}
3. 作成したTopoJsonファイルをLookerに追加
LookerのFileBrowserを開いて、先ほど作成したTopoJsonファイルを追加します。
追加後、適切なフォルダにファイルを移動します。ここではmaps/h3フォルダにTopoJsonファイルを移動します。
├── maps
    └── h3
        ├── h3_hex_id_res_0.topojson
        ├── h3_hex_id_res_1.topojson
        ├── h3_hex_id_res_2.topojson
                ...
        └── h3_hex_id_res_15.topojson
4. Lookerのmodelファイルにmap_viewフィールドを追加
下記のようにmap_layerを設定します。map_layerはH3解像度別に設定しています。
property_keyは「2. TopoJsonファイルの作成」で使用しているH3ToGeojson.get_h3_geojson_featuresメソッド内のgeojson.Featureの引数で設定しているpropertiesのkey名であるh3_hex_idを指定しています。
map_layer: h3_hex_id_res_0 {
  file: "/maps/h3/h3_hex_id_res_0.topojson"
  format: topojson
  property_key: "h3_hex_id"
}

map_layer: h3_hex_id_res_1 {
  file: "/maps/h3/h3_hex_id_res_1.topojson"
  format: topojson
  property_key: "h3_hex_id"
}

map_layer: h3_hex_id_res_2 {
  file: "/maps/h3/h3_hex_id_res_2.topojson"
  format: topojson
  property_key: "h3_hex_id"
}

...

map_layer: h3_hex_id_res_15 {
  file: "/maps/h3/h3_hex_id_res_15.topojson"
  format: topojson
  property_key: "h3_hex_id"
}
5. Lookerのviewファイルにdimensionを追加
map_layer_nameは、「4. Lookerのmodelファイルにmap_viewフィールドを追記」で作成した、map_layer名を指定します。
dimensionはH3解像度別に設定しています。
view: h3_places {
  sql_table_name: `sample-project.sample-dataset.h3_places`
    ;;

  dimension: h3_hex_id_res_0 {
    group_label: "H3"
    group_item_label: "H3解像度0の六角形ID"
    type: string
    sql: ${TABLE}.h3_hex_id_res_0 ;;
    map_layer_name: h3_hex_id_res_0
  }

  dimension: h3_hex_id_res_1 {
    group_label: "H3"
    group_item_label: "H3解像度1の六角形ID"
    type: string
    sql: ${TABLE}.h3_hex_id_res_1 ;;
    map_layer_name: h3_hex_id_res_1
  }

  dimension: h3_hex_id_res_2 {
    group_label: "H3"
    group_item_label: "H3解像度2の六角形ID"
    type: string
    sql: ${TABLE}.h3_hex_id_res_2 ;;
    map_layer_name: h3_hex_id_res_2
  }

  ...

  dimension: h3_hex_id_res_15 {
    group_label: "H3"
    group_item_label: "H3解像度15の六角形ID"
    type: string
    sql: ${TABLE}.h3_hex_id_res_15 ;;
    map_layer_name: h3_hex_id_res_15
  }

}
6 Lookerのmodelファイルにexploreを追加
下記のようにexploreを追加します。
explore: sales {
  label: "sales"
  ...

  join: h3_places {
    view_label: "place"
    type: inner
    sql_on: ${sales.place_id} = ${h3_places.place_id} ;;
    relationship: many_to_one
  }

}
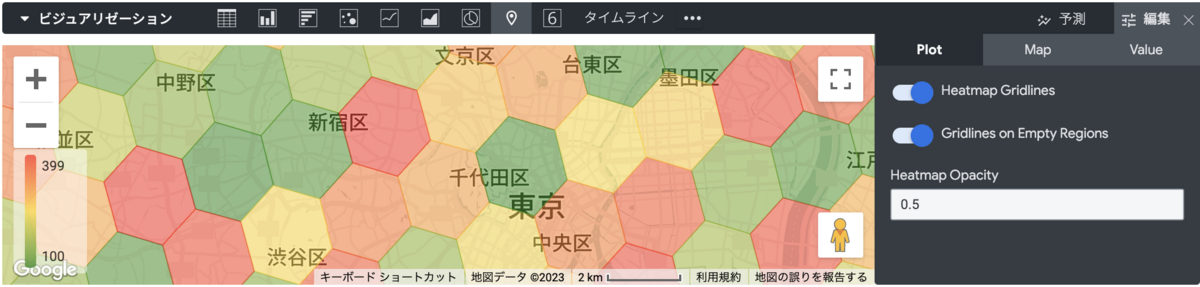
7. Lookerでの可視化
作成したexploreでマップでの可視化を行うと、地図上にH3六角形メッシュが表示され、メッシュ毎にバケット化された集計値を色で表現することができます。
下記は東京近郊のデータをH3解像度7のdimensionを使用して可視化した例です(数値はランダム値です)。
今回作成したH3解像度dimensionを変更することで、目的に合わせて六角形メッシュの大きさを変更して可視化を行うことが可能です。
まとめ
今回は、Uber社がオープンソースとして提供しているH3を使用して、Looker上で可視化を行う方法について解説しました。
タイミーでは今回紹介したLookerでの可視化以外にも、機械学習の特徴量作成時に使用するなど、様々な場面でH3を活用しています。
今後も地理情報を活かした分析をする際に活用していきたいと考えています。
We’re Hiring!
タイミーのデータ統括部では、ともに働くメンバーを募集しています!!
現在募集中のポジションはこちらです!
「話を聞きたい」と思われた方は、是非一度カジュアル面談でお話ししましょう!